ChartCraft
Design stunning BI dashboards in seconds with AI. Generate Power BI, Tableau, Looker & Qlik visualizations from your business requirements.
ChartCraft is an AI‑driven studio that creates business‑intelligence dashboards from textual descriptions of data needs. Users provide their business requirements, and the system produces ready‑to‑use visualizations for platforms such as Power BI, Tableau, Looker, and Qlik without requiring design expertise. The tool focuses on turning high‑level specifications into complete dashboard layouts, handling chart selection, arrangement, and styling automatically.
The software targets analysts, data engineers, and business users who need to prototype or deliver dashboards quickly but lack time or design skills. By generating visual assets in seconds, it aims to streamline the early stages of BI development and reduce manual effort.
ChartCraft is presented as an experimental project, offering a web‑based interface that leverages AI to interpret user input and output platform‑specific dashboard files. It emphasizes ease of use and rapid creation of polished visualizations across multiple BI ecosystems.
Reviews
Loading reviews…
Similar apps

AI Agents & Automation
ClarityAI: AI Analytics for Non
Ask Atlas a question. Get a live dashboard in 60 seconds. No SQL. No data team. No setup.
.png)
Task & Project Management
OrcaSheets AI Reports
Query data to build dashboards and generate detailed reports

Clipboard, Input & Automation
Flitch
Turn your data into insights
Task & Project Management
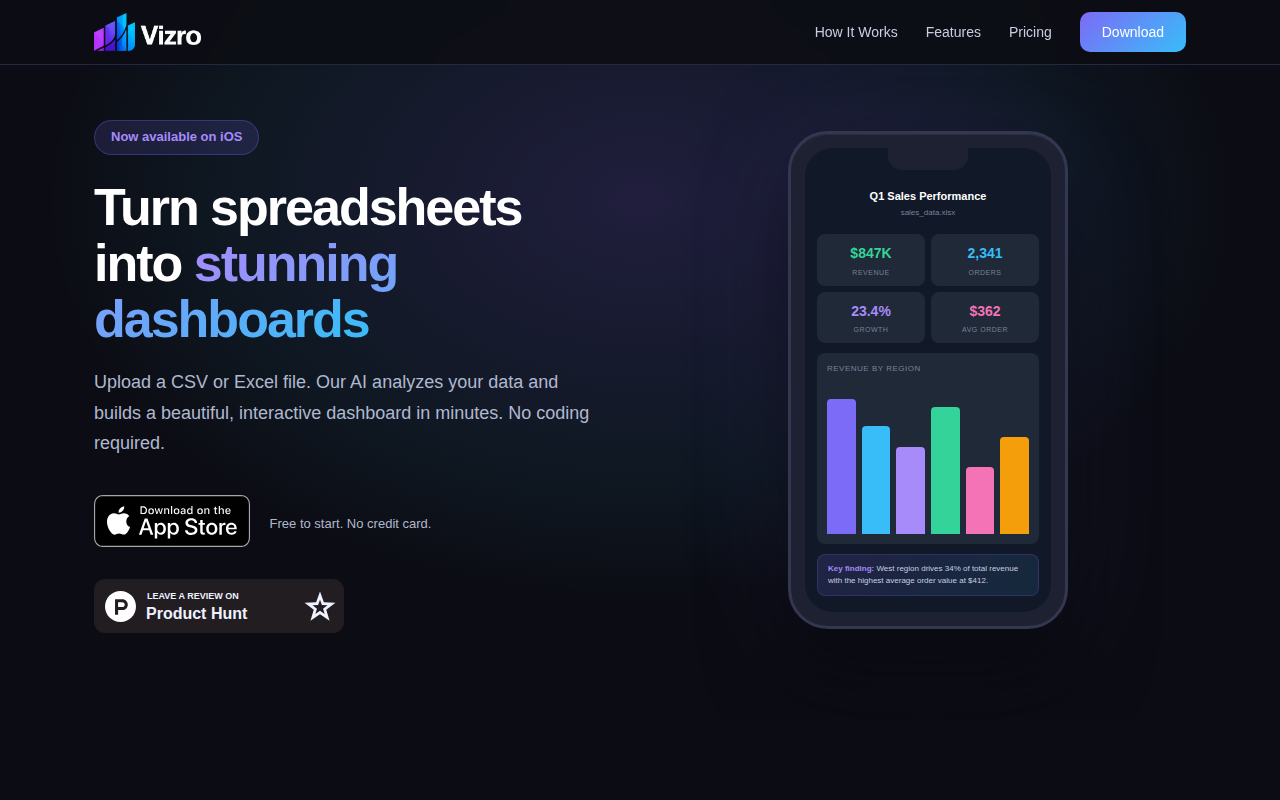
Vizro
Turn any spreadsheet into a dashboard, on your phone
Photo & Video Management
CastingNinja
Self-tape auditions with an AI scene partner

AI Photo Editing
PhotoCrafter: AI Photo Editor
Professional-quality edits in seconds