PingPlotter
Network monitoring tool
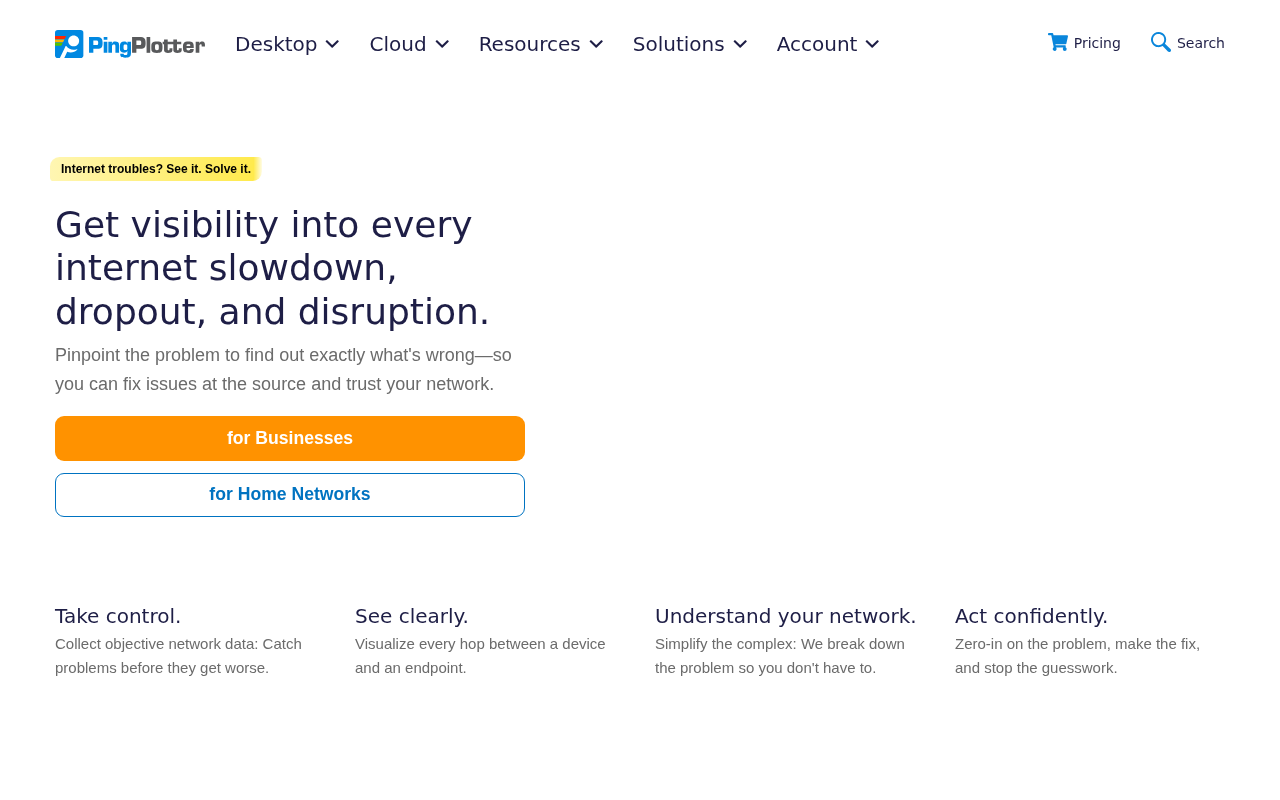
PingPlotter continuously records latency, packet loss and jitter for network connections, displaying the data on an infinite timeline that shows each hop between a device and its destination. The graphical interface lets users visualize where performance degrades, making it easier to locate congestion, loss, or device unavailability. Results can be saved and shared with colleagues, ISPs or support teams to provide concrete evidence of network issues.
The tool is aimed at both IT professionals and non‑technical users who need a clear view of network health for troubleshooting or ongoing monitoring. It supports unlimited connections on a desktop computer and can run in the background, automatically gathering metrics 24 hours a day, seven days a week. A cloud version offers a centralized dashboard for remote connections, but the core desktop product works independently on macOS.
What distinguishes PingPlotter is its focus on visualizing each hop on a timeline, allowing users to pinpoint the exact segment causing slowdown or dropouts without requiring deep networking expertise. The interface presents data in easy‑to‑read charts, and the software can be used for both short‑term diagnostics and long‑term performance tracking.
Reviews
Loading reviews…
Similar apps
Network & Connectivity
NetViews
Network and Wi-Fi diagnostic tool
Network & Connectivity
PingMenu
Utility that shows the current network latency in the menu bar

Network & Connectivity
pingnoo
Open-source cross-platform traceroute/ping analyser
Network & Connectivity
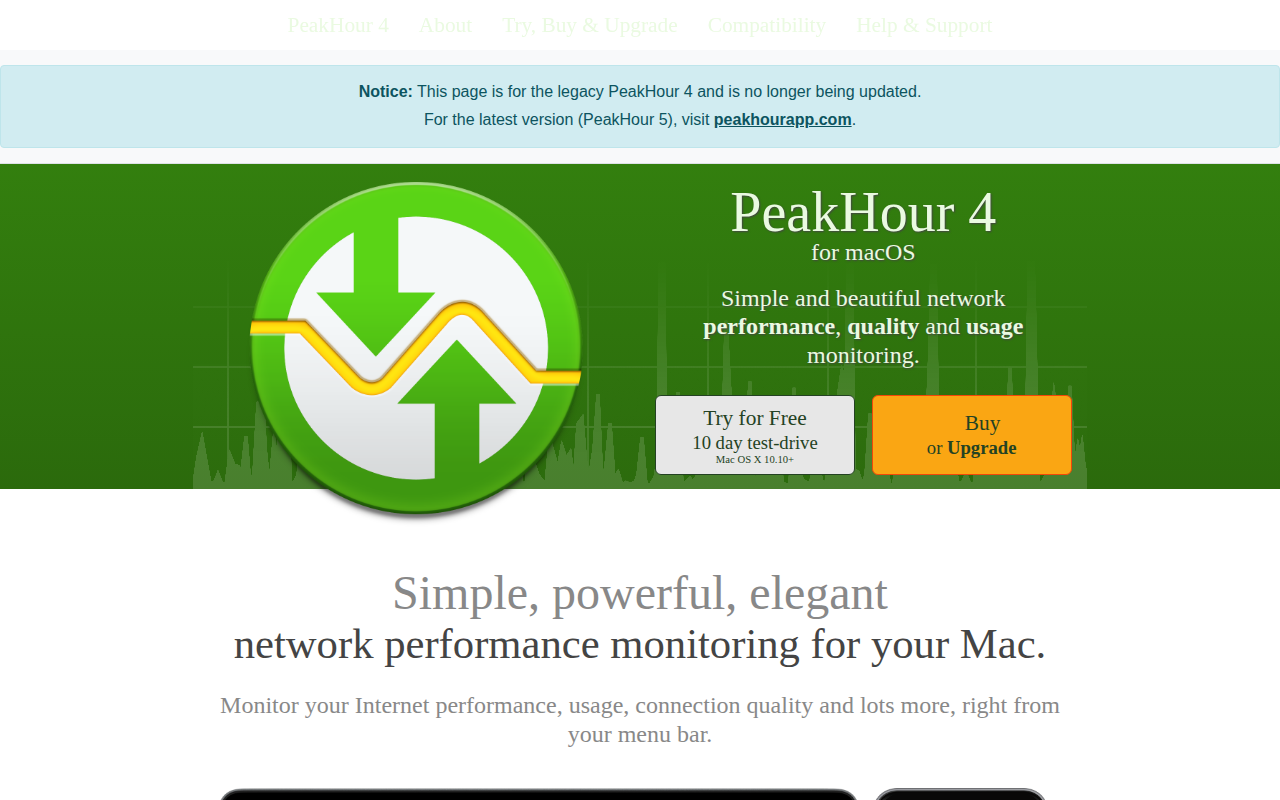
PeakHour
Network bandwidth and network quality visualiser
Task & Project Management
NetSpot
WiFi site survey software and WiFi scanner
Network & Connectivity
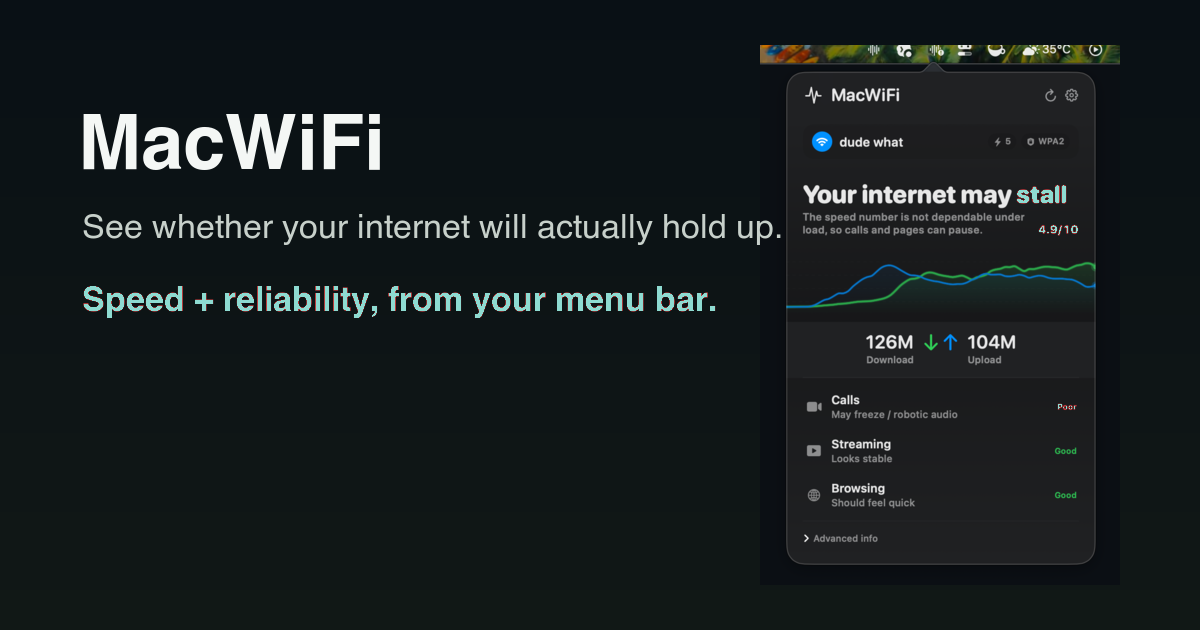
MacWiFi
Know if your internet is flaky before your next call