
JProfiler
Java profiler
JProfiler gathers both high‑level analytics and low‑level JVM metrics to identify performance problems such as bottlenecks, memory leaks, slow JDBC or JPA queries, and expensive HTTP calls. The tool presents the data in an interactive UI and can also forward it to an AI agent via the MCP server for autonomous diagnosis. It includes specialized probes for databases, MongoDB, Kafka, and HTTP traffic, and it understands Spring and JEE components to correlate method calls with framework context.
The profiler works with applications running in containers, offering built‑in support for Kubernetes and Docker, and it can attach to remote JVMs using SSH without requiring additional agents or configuration. Live data is displayed continuously, and snapshots can be captured automatically through triggers or an API for offline analysis.
Integration is provided through plugins for popular IDEs such as IntelliJ IDEA, VS Code, Eclipse, and NetBeans, allowing developers to start profiling with a single click from their development environment.
Reviews
Loading reviews…
Similar apps
DevOps & Infrastructure
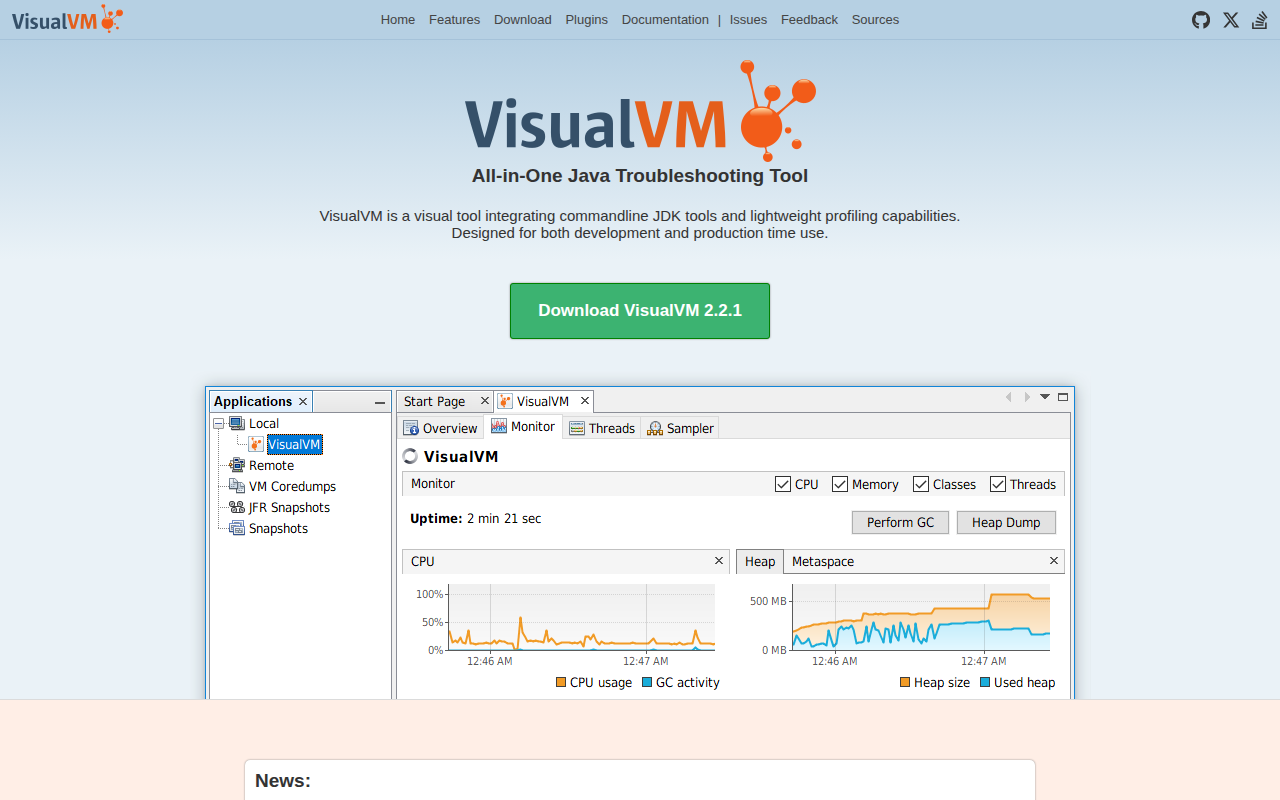
VisualVM
All-in-One Java Troubleshooting Tool
Code Editors & IDEs
GraalVM Java Development Kit
GraalVM from Oracle
Databases & Data Tools
DbVisualizer
Database management and analysis tool
Task & Project Management
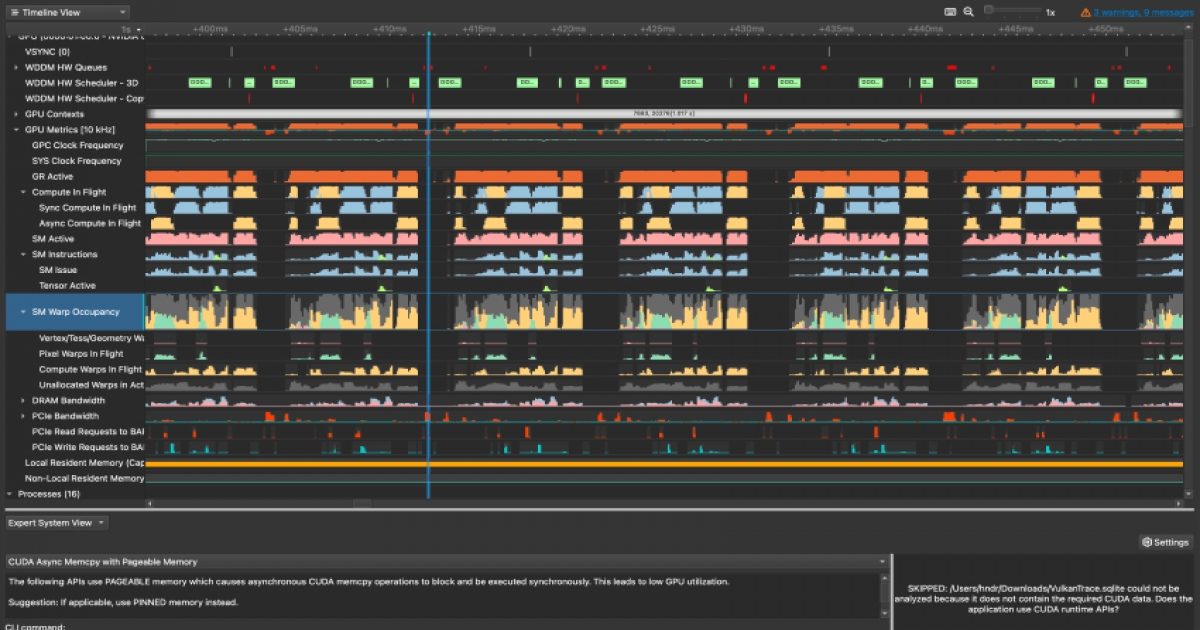
NVIDIA Nsight Compute
Interactive profiler for CUDA and NVIDIA OptiX
Code Editors & IDEs
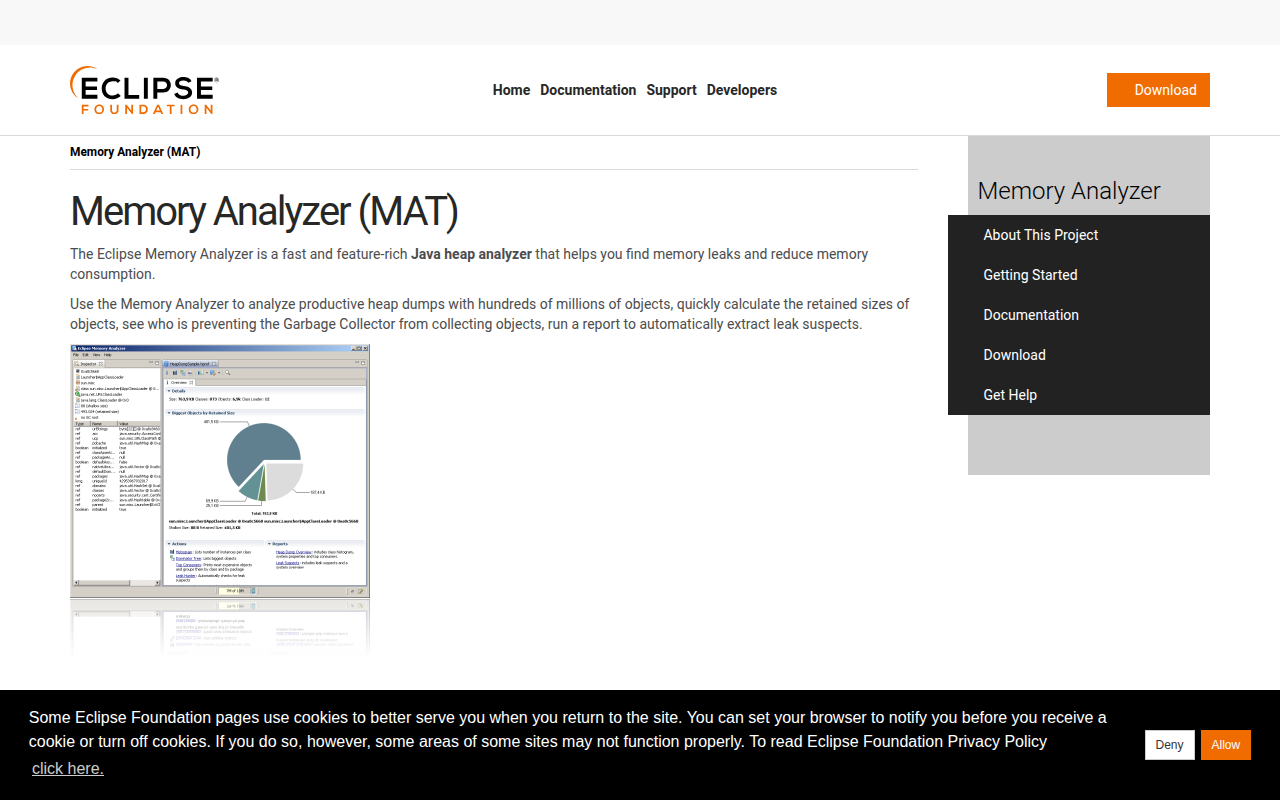
Eclipse Memory Analyzer
Java heap analyzer
Code Editors & IDEs
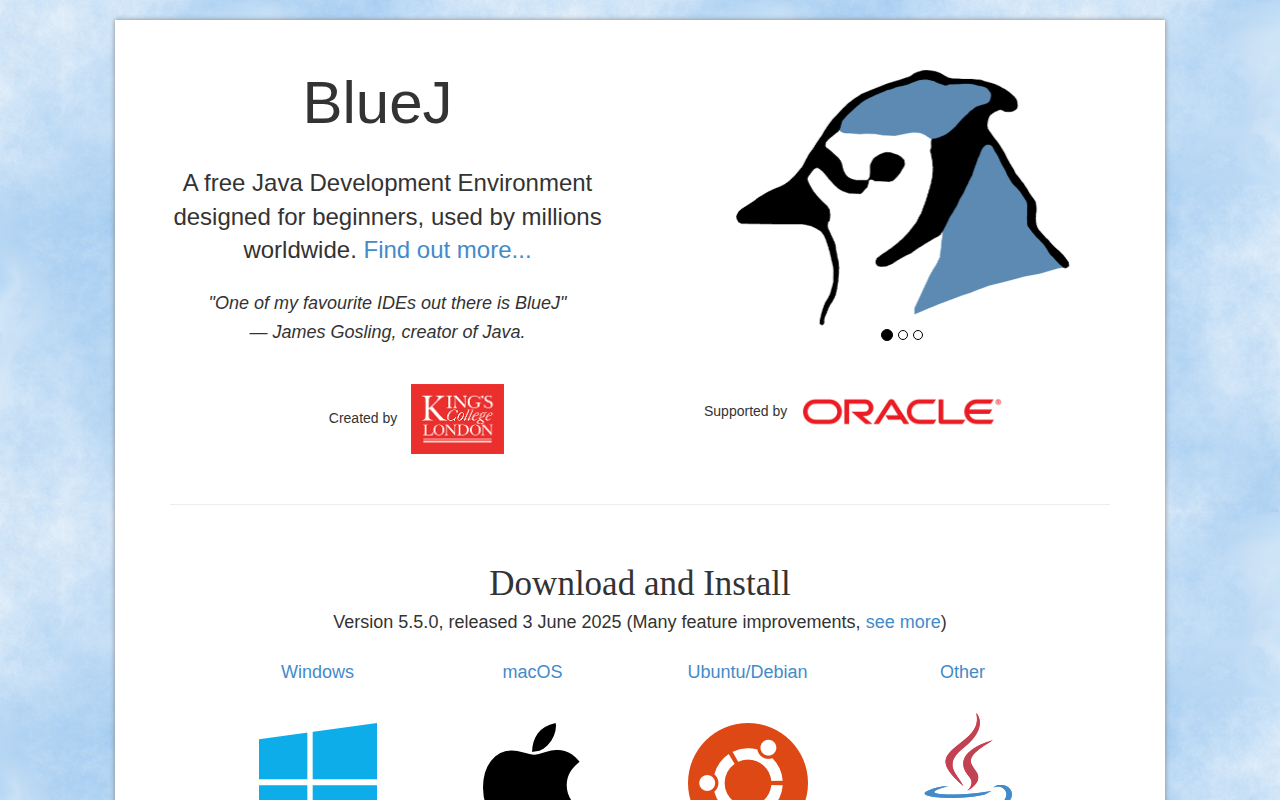
BlueJ
Java Development Environment designed for beginners