NVIDIA Nsight Compute
Interactive profiler for CUDA and NVIDIA OptiX
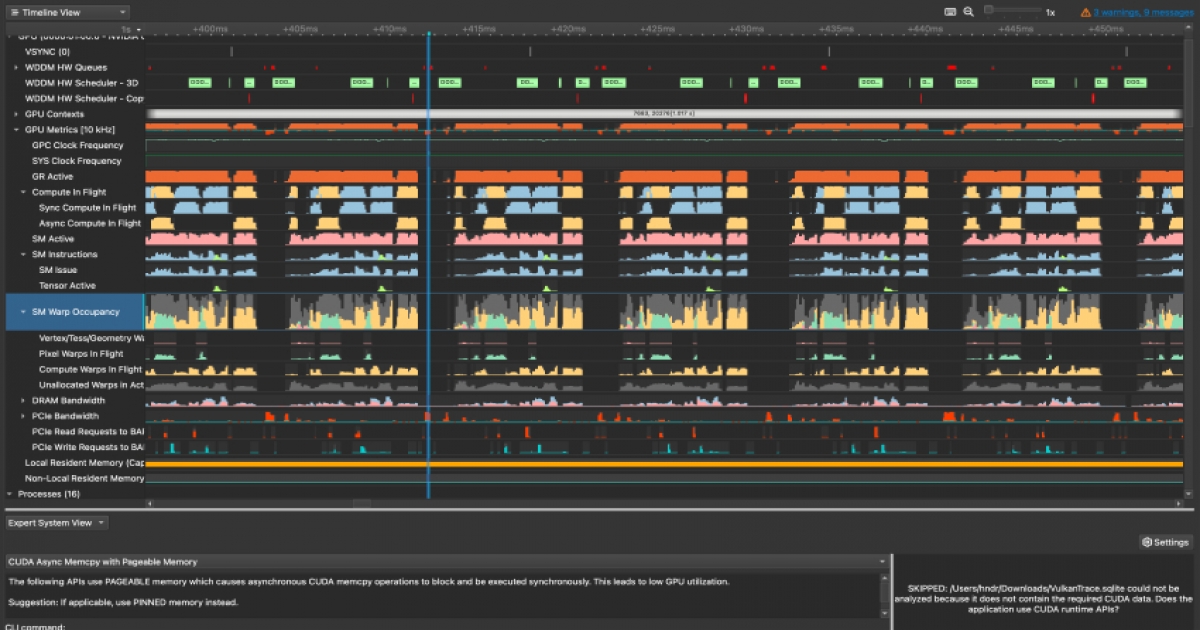
Nsight Compute is an interactive profiling tool for CUDA and NVIDIA OptiX applications. It gathers detailed performance metrics, correlates them with source code, and offers API debugging through both a graphical user interface and a command‑line utility. The profiler can examine GPU throughput, warp state statistics, and memory workload, and it supports CUDA graphs and guided analysis to highlight optimization opportunities.
The tool is aimed at developers who need to tune kernel performance or troubleshoot OptiX pipelines. It presents hardware activity in a hierarchical view, allowing users to trace issues down to individual lines of code, and it includes built‑in guidance from NVIDIA engineers on common performance limiters. Results can be compared, post‑processed, and integrated into custom analysis workflows.
Nsight Compute can be extended with user‑defined metrics and integrates with the broader Nsight suite, including Nsight Systems and Nsight Graphics. It is distributed as part of the CUDA Toolkit and runs on macOS, offering a stable, production‑ready solution for GPU compute profiling.
Reviews
Loading reviews…
Similar apps
Remote Access & VPN
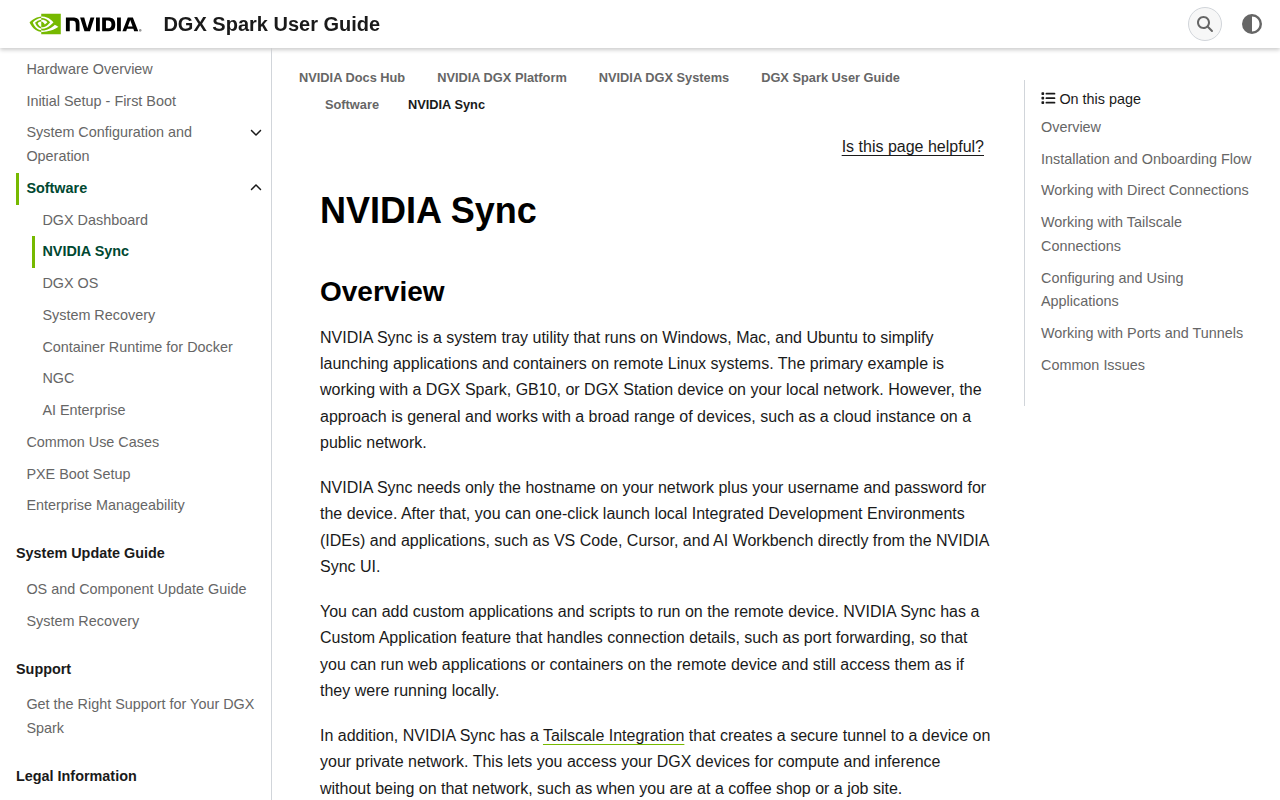
NVIDIA Sync
Utility for launching applications and containers on remote Linux systems

DevOps & Infrastructure
JProfiler
Java profiler
DevOps & Infrastructure
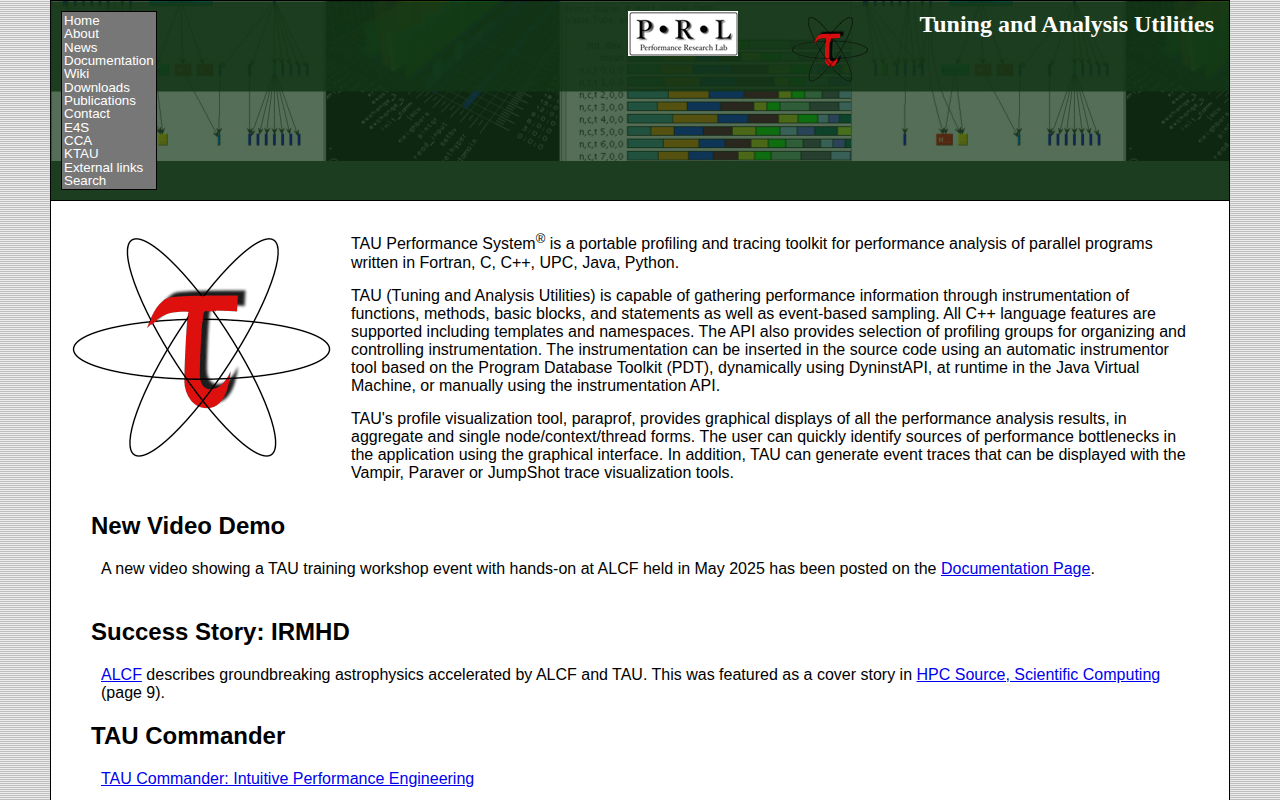
TAU
Profiling and tracing toolkit
System Monitoring & Maintenance
Novabench
Benchmark tool to quickly test and compare the computer's performance

DevOps & Infrastructure
agi
Android GPU Inspector
Code Editors & IDEs
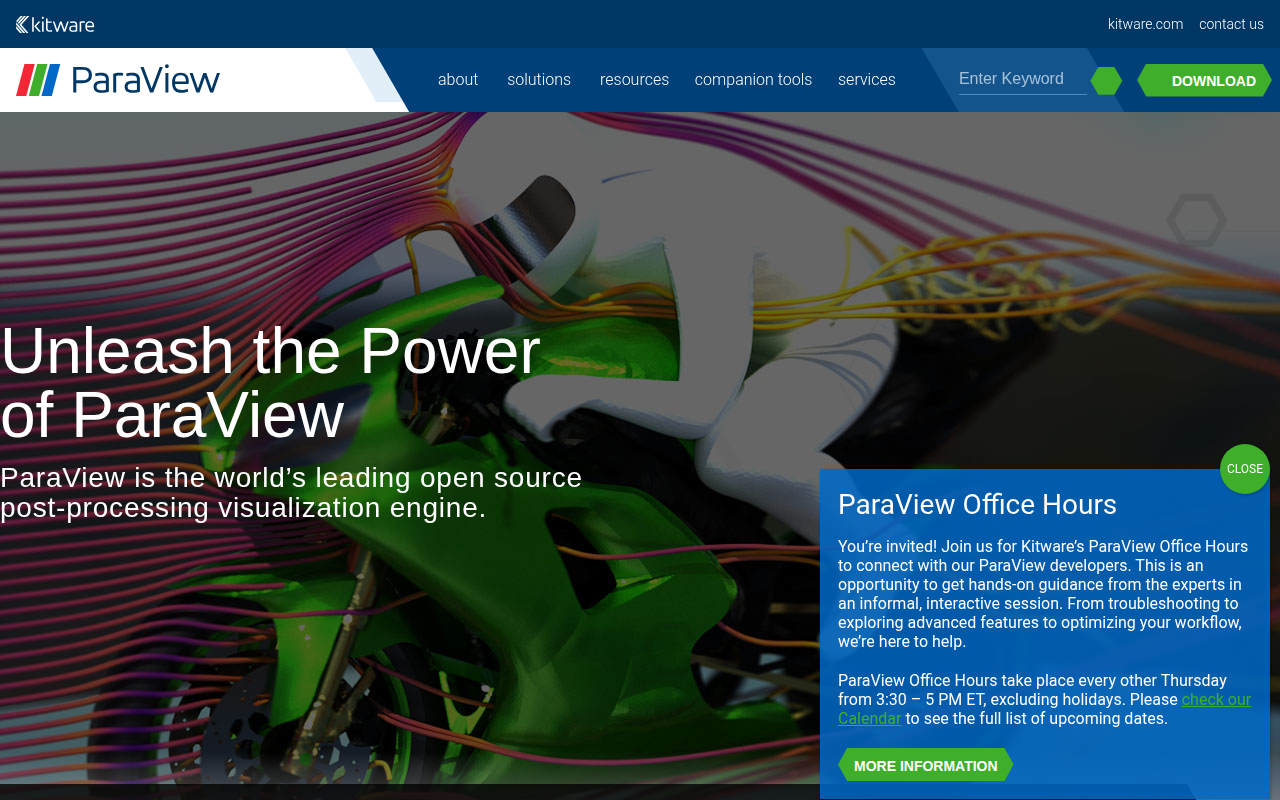
ParaView
Data analysis and visualization application