ParaView
Data analysis and visualization application
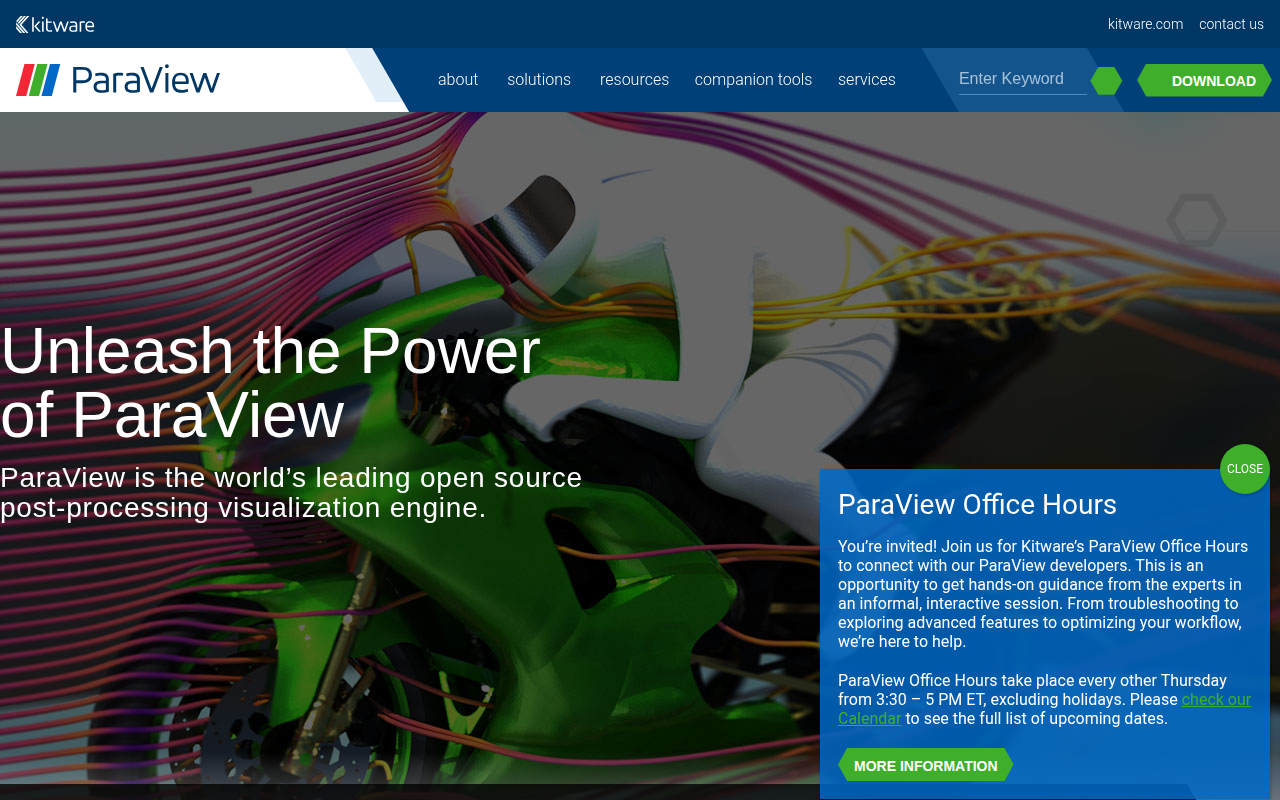
ParaView is an open‑source application for analyzing and visualizing scientific data. It supports a wide range of data sizes, from petascale datasets processed on supercomputers to smaller collections handled on laptops. The software provides both post‑processing visualization and in‑situ analysis through its Catalyst component, and it can be accessed via a web browser using the trame interface.
The tool is aimed at researchers and engineers in fields such as material science, medical science, computational fluid dynamics, and sensor data processing. Users can explore complex data structures, generate visual representations, and interact with results in real time. The platform runs on multiple operating systems, including macOS, and is maintained by Kitware with a long history of community contributions.
Distinctive aspects include its ability to operate on distributed memory resources, enabling analysis of extremely large datasets, and its integration of web‑based and in‑situ workflows. ParaView also offers companion tools, training resources, and developer office hours to support custom usage and troubleshooting.
Reviews
Loading reviews…
Similar apps
Code Editors & IDEs
VisIt
Visualisation and data analysis for mesh-based scientific data
Code Editors & IDEs
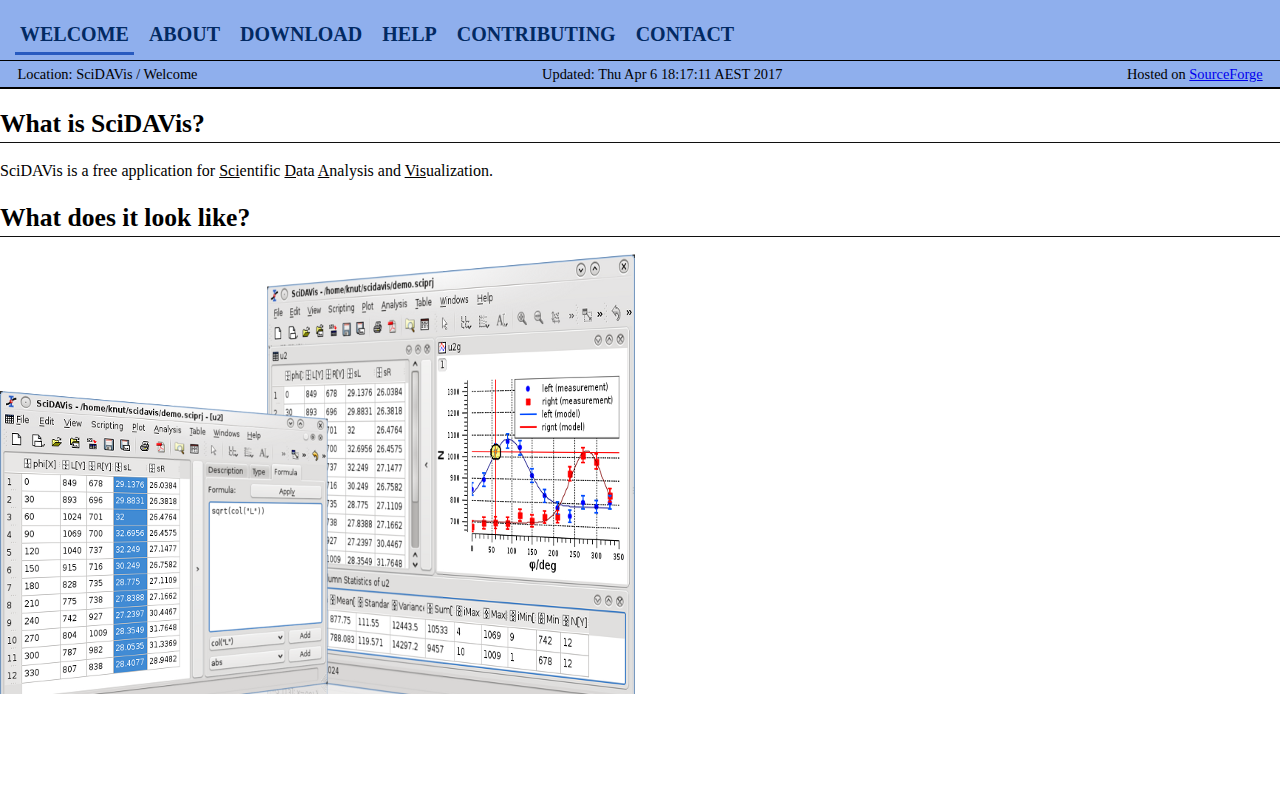
SciDAVis
Application for scientific data analysis and visualization

Code Editors & IDEs
OVITO
Scientific data visualization and analysis software
Databases & Data Tools
LabPlot
Data visualization and analysis software
Code Editors & IDEs
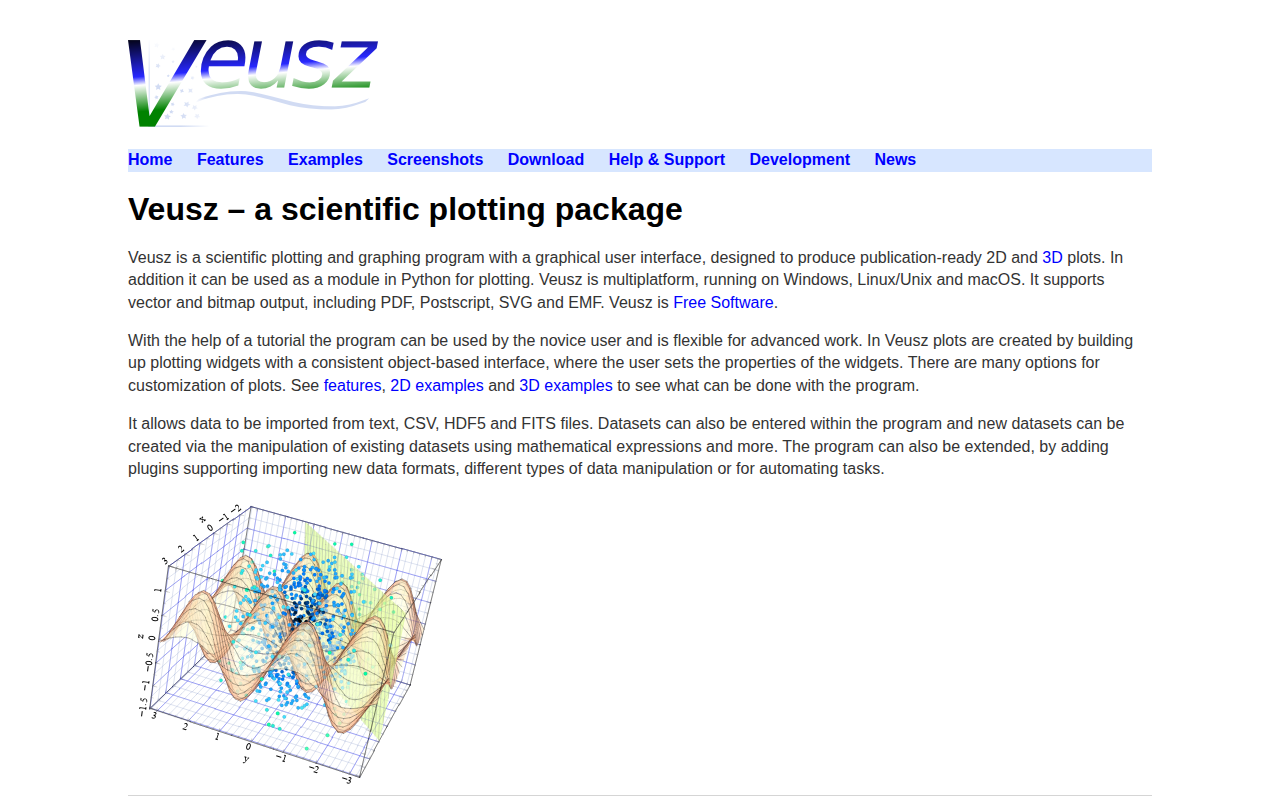
Veusz
Scientific plotting application
Code Editors & IDEs
PicoScope
Test and measurement oscilloscope software for PicoScope oscilloscopes