LabPlot
Data visualization and analysis software
LabPlot provides a free, open‑source environment for creating high‑quality visualizations and performing data analysis. Users can generate interactive plots with a few clicks, apply statistical tools, regression models, and curve or peak fitting, and work with real‑time data streams. The software includes a plot digitizer for extracting data from existing images and supports import and export across multiple file formats.
The application is built for cross‑platform use, running on Windows, macOS, Linux, FreeBSD and Haiku, and offers customizable theming to fit user preferences. It integrates with interactive notebooks, allowing scripts written in Python, R, or Julia to be executed directly within the interface, which streamlines computational workflows.
LabPlot is aimed at researchers, engineers, and analysts who need reliable, reproducible visual and analytical capabilities without proprietary restrictions. Its stable, mature codebase is maintained by a community of contributors and has received funding to continue development of core features.
Reviews
Loading reviews…
Similar apps
Code Editors & IDEs
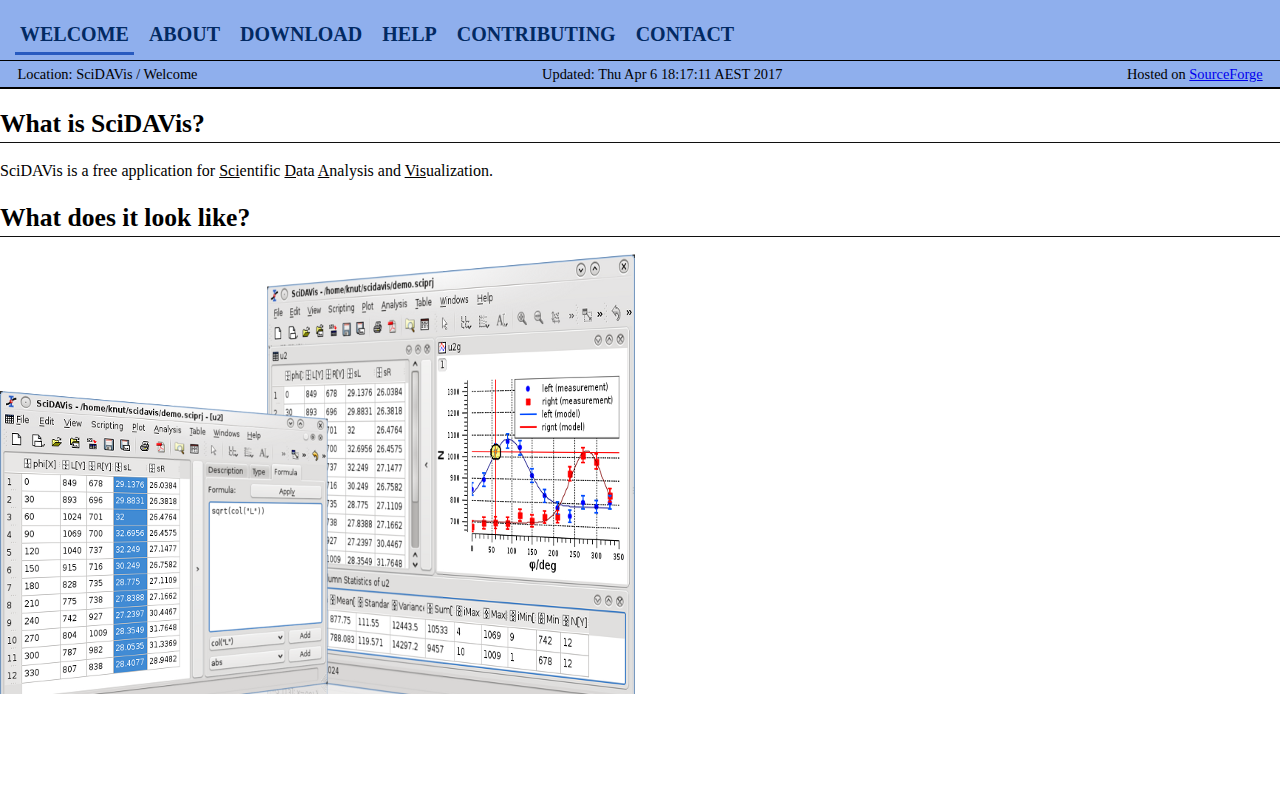
SciDAVis
Application for scientific data analysis and visualization
Code Editors & IDEs
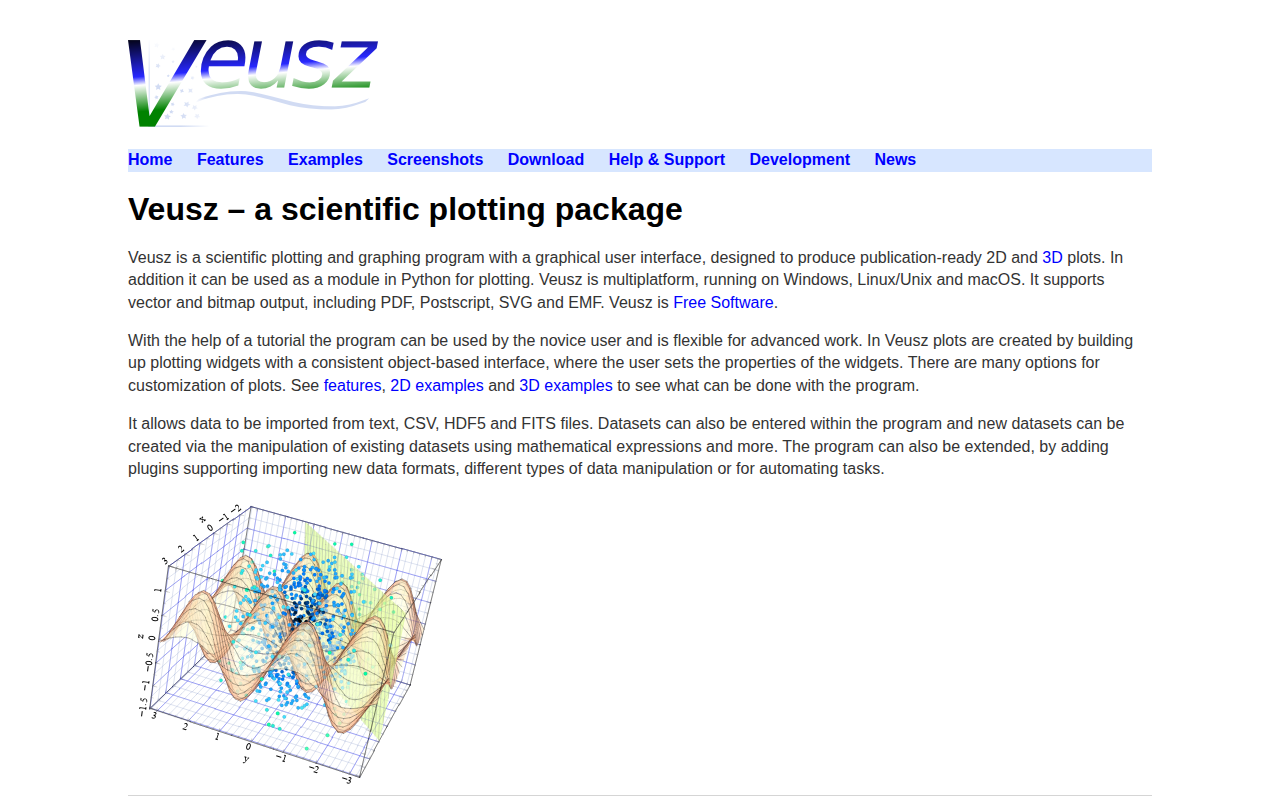
Veusz
Scientific plotting application
Documents, Forms & Contracts
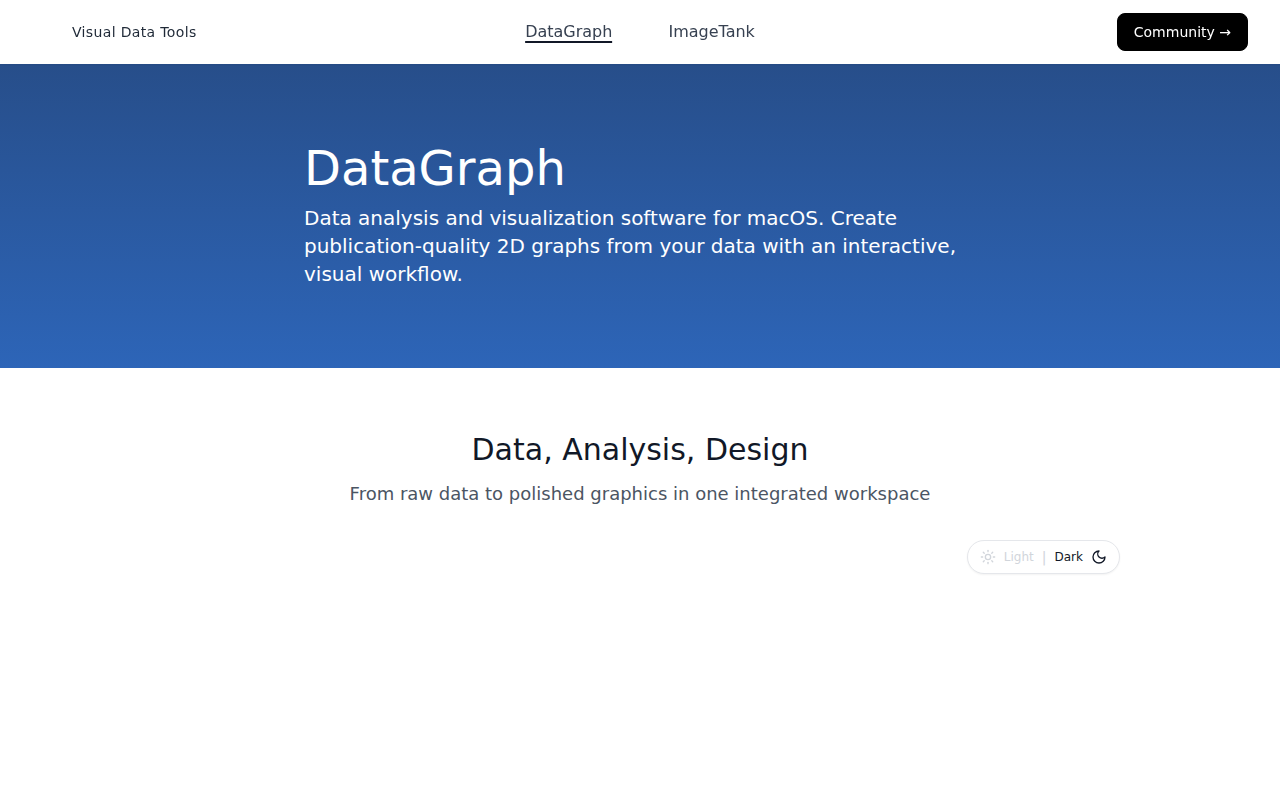
DataGraph
Scientific/statistical graphing software

Task & Project Management
GraphPad Prism
Statistical analysis and graphing software

Code Editors & IDEs
ParaView
Data analysis and visualization application

System Monitoring & Maintenance
WebPlotDigitizer
Extract numerical data from plot images