
WebPlotDigitizer
Extract numerical data from plot images
WebPlotDigitizer is a web‑based tool that uses computer‑vision techniques to convert visual representations of data—such as line graphs, scatter plots, bar charts, and other chart types—into numerical values. Users upload an image of a plot, align axes, and then let the software detect points or bars, producing a table of coordinates or measurements that can be copied or exported for further analysis. The interface supports manual refinement, allowing precise selection of data points when automatic detection requires adjustment.
The application is intended for researchers, analysts, and anyone who needs to recover underlying data from published figures, reports, or scanned documents. It runs in a browser on macOS and other platforms, requiring no local installation beyond a modern web browser. By automating the extraction process, it reduces the time and effort compared with manual digitization.
Key capabilities include support for multiple chart styles, axis calibration, and export of results in common formats such as CSV. The software is listed as stable and is maintained as an open‑source project, offering a reliable solution for extracting quantitative information from visual sources.
Reviews
Loading reviews…
Similar apps
Task & Project Management
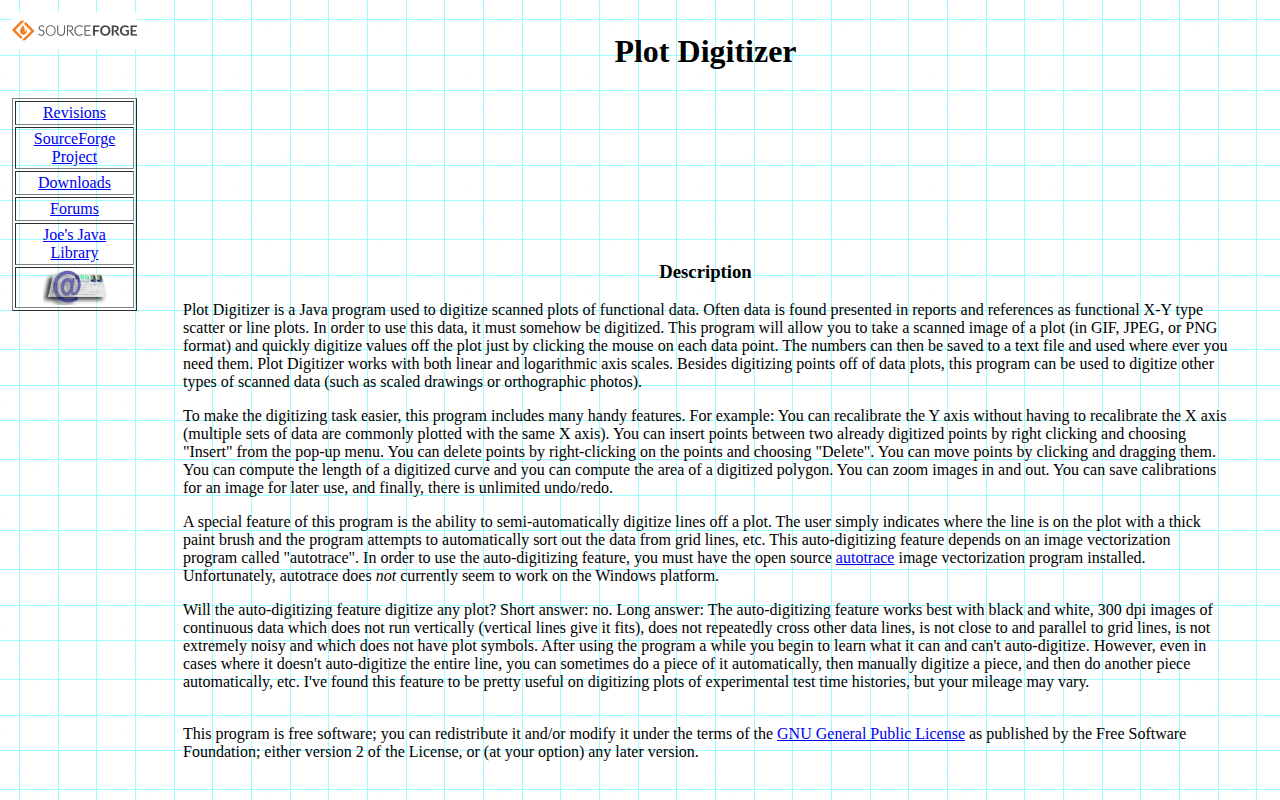
Plot Digitizer
Digitize scanned plots of functional data
Documents, Forms & Contracts
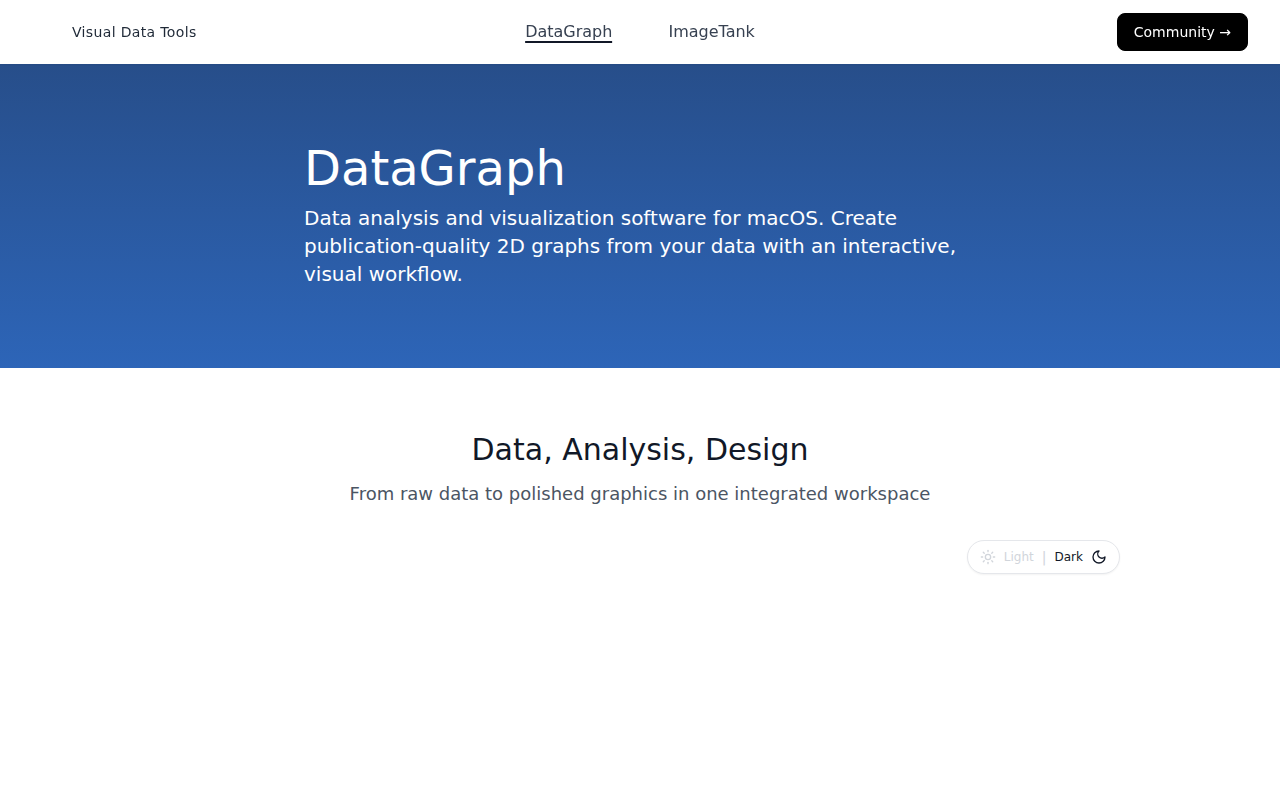
DataGraph
Scientific/statistical graphing software
Code Editors & IDEs
OpenChrom
Data analysis for analytical chemistry

Photo & Video Management
CellProfiler
Open-source application for biological image analysis
Databases & Data Tools
LabPlot
Data visualization and analysis software
Code Editors & IDEs
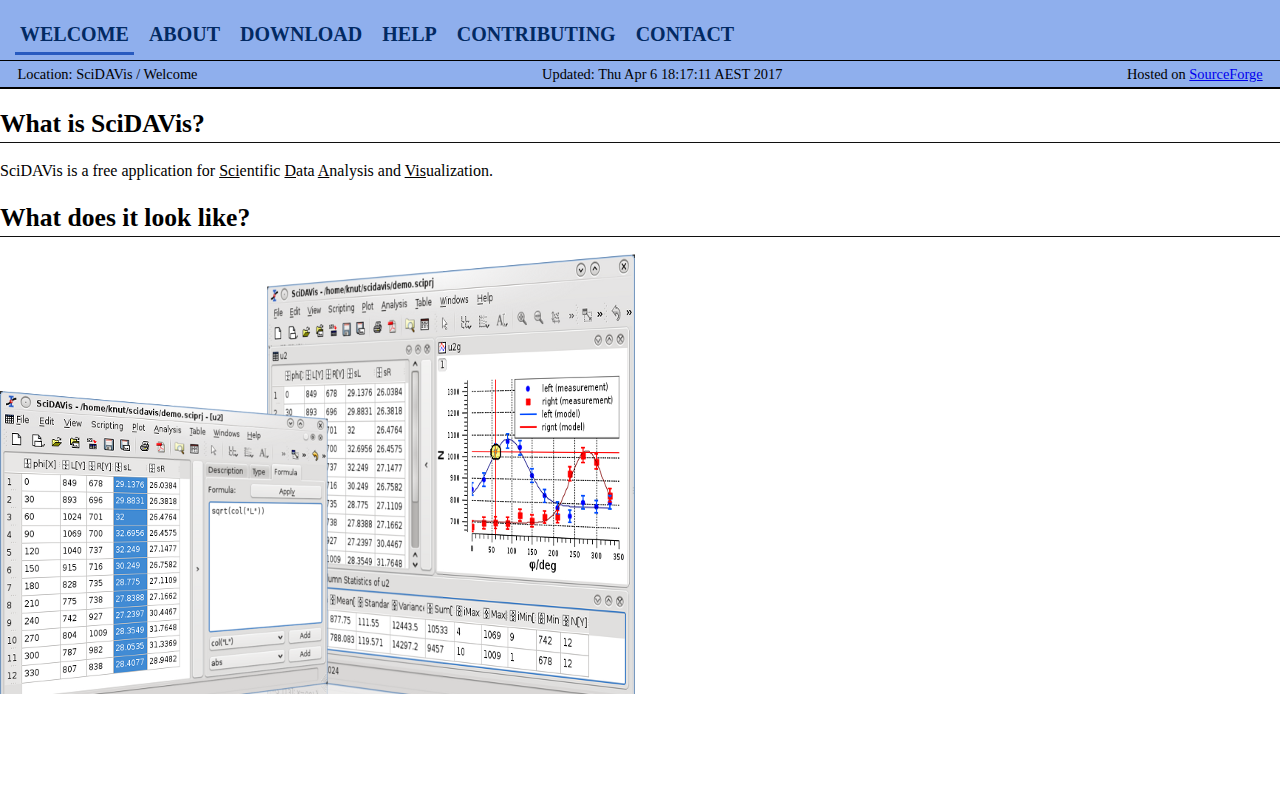
SciDAVis
Application for scientific data analysis and visualization