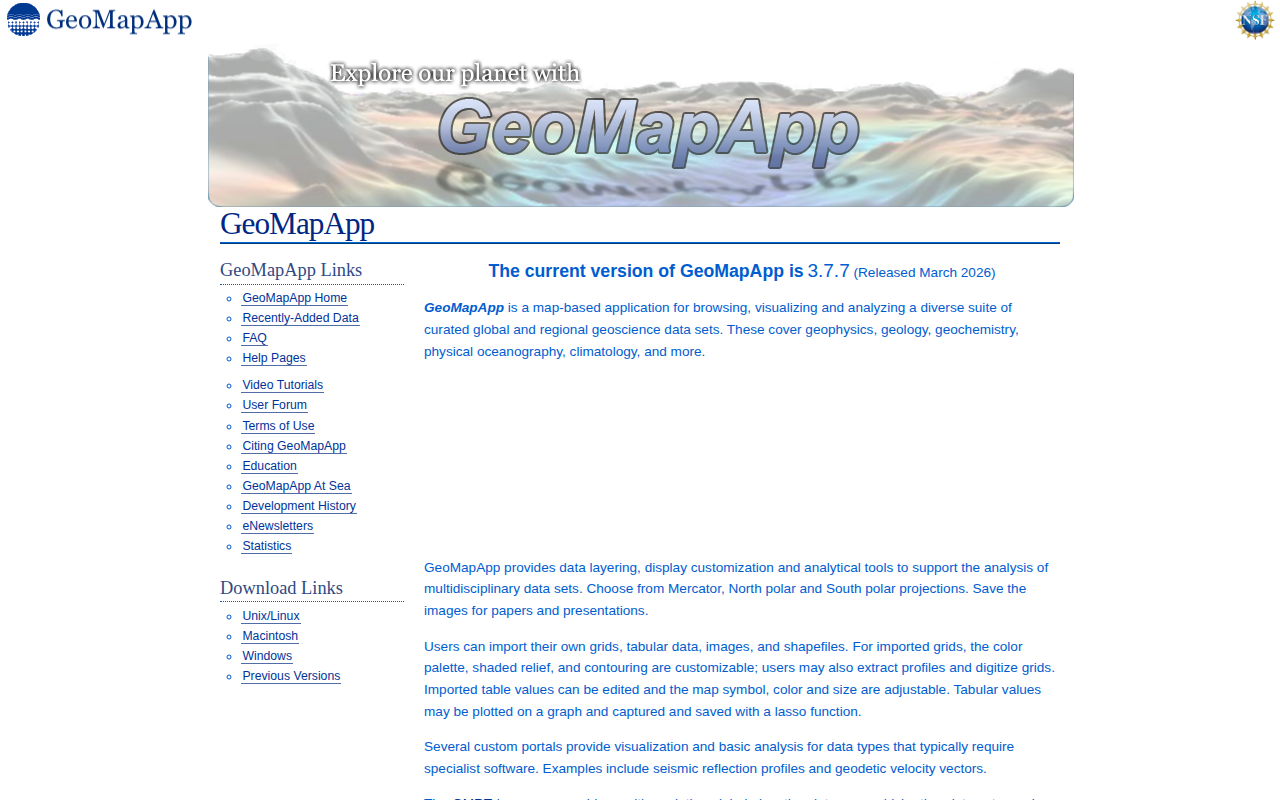
GeoMapApp
Browse, visualise and analyze geoscience data sets
GeoMapApp is a map‑based tool that lets users browse, visualize, and analyze a wide range of curated geoscience data sets, including geophysics, geology, geochemistry, physical oceanography, and climatology. It supports multiple map projections (Mercator, North polar, South polar) and offers layering, display customization, and analytical functions such as profile extraction, grid digitization, and contour generation. Users can also import their own grids, tables, images, and shapefiles, with adjustable color palettes, shaded relief, and symbol properties, and can plot tabular data with interactive lasso selection.
The application is built on Java and runs on Windows, macOS, Linux, and Unix/Solaris, with an optional Java WebStart launch for browser‑based use. It includes custom portals for specialized visualizations like seismic reflection profiles and geodetic velocity vectors, and uses the GMRT base map for multi‑resolution global elevation data that other layers can be overlaid upon.
GeoMapApp is maintained by the Marine Geoscience Data System at Columbia University and is used by educators, researchers, and students for data discovery, proposal preparation, presentation figure generation, and classroom instruction across graduate, undergraduate, and high‑school levels.
Reviews
Loading reviews…
Similar apps
Databases & Data Tools
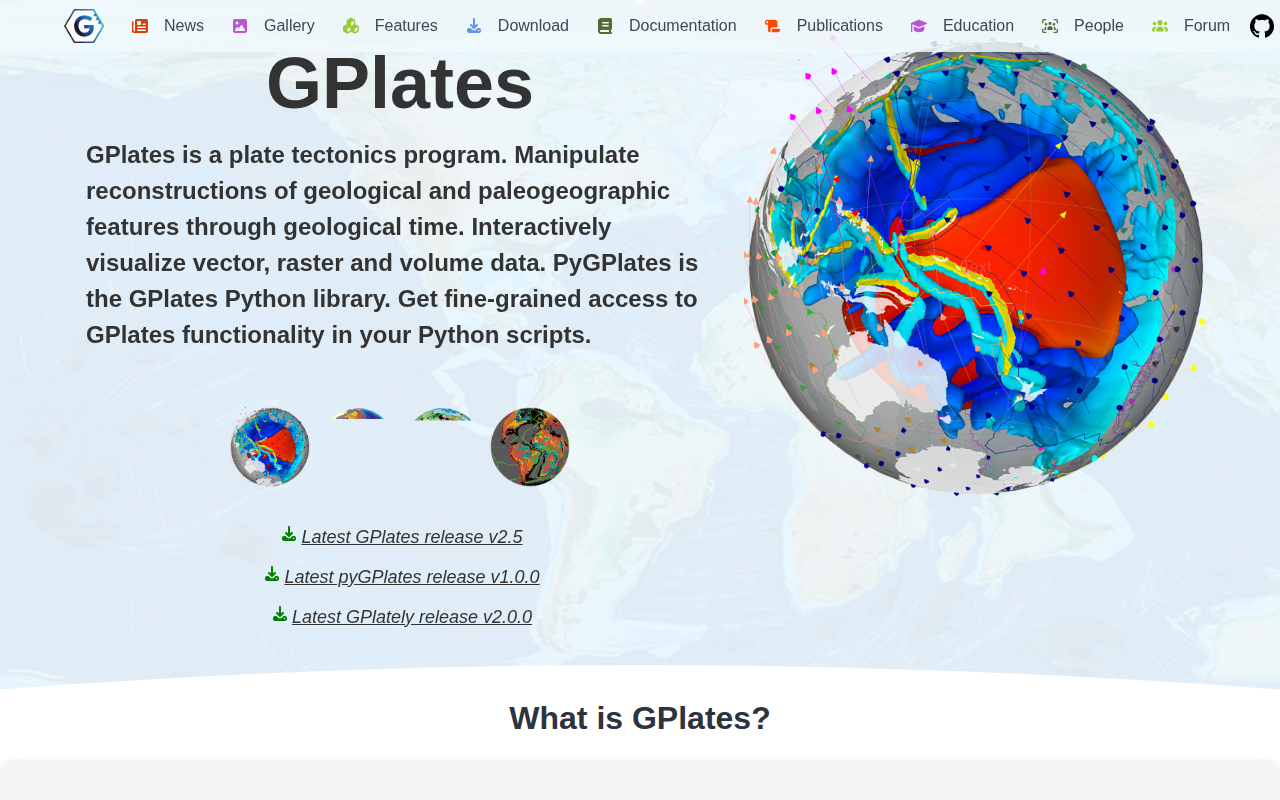
GPlates
Plate tectonics program

Databases & Data Tools
Grid Analysis and Display System
Access, manipulate, and visualise earth science data
Databases & Data Tools
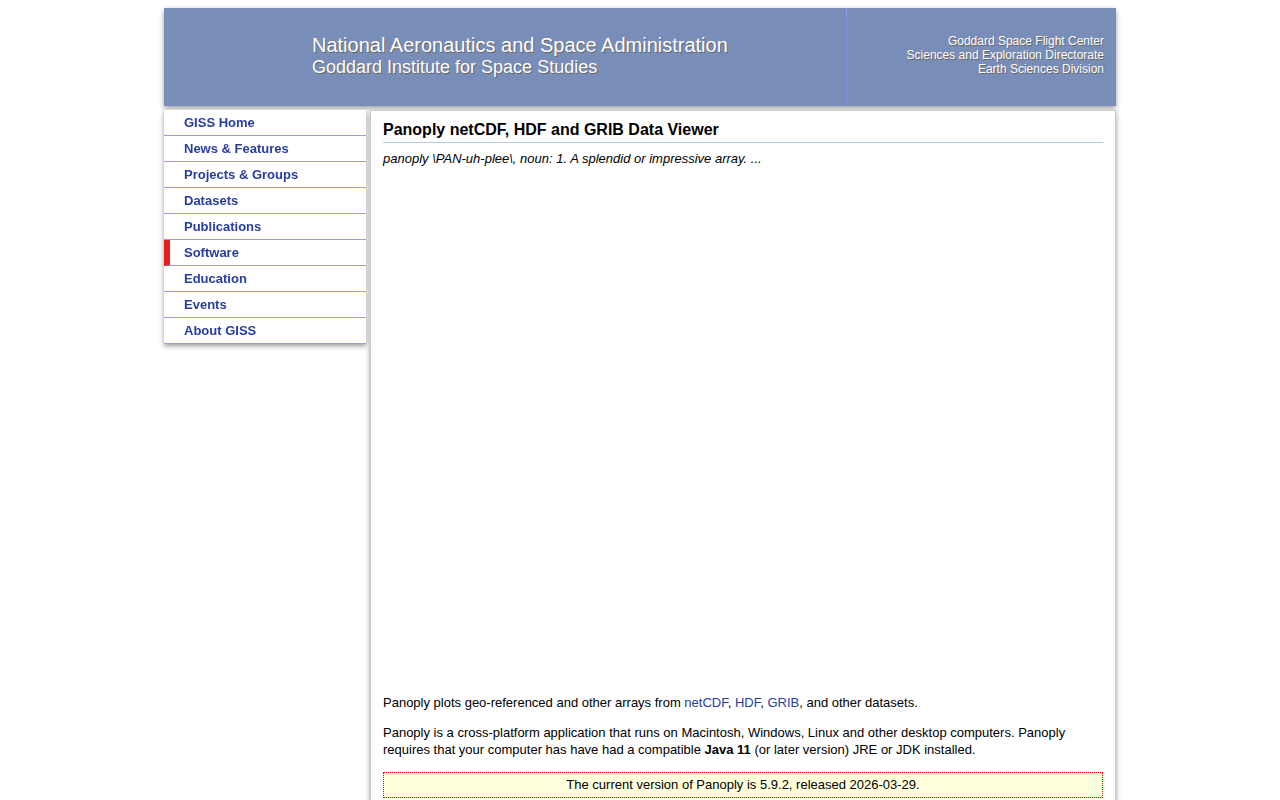
Panoply netCDF, HDF and GRIB Data Viewer
Plot geo-referenced data from netCDF, HDF, and GRIB
Databases & Data Tools
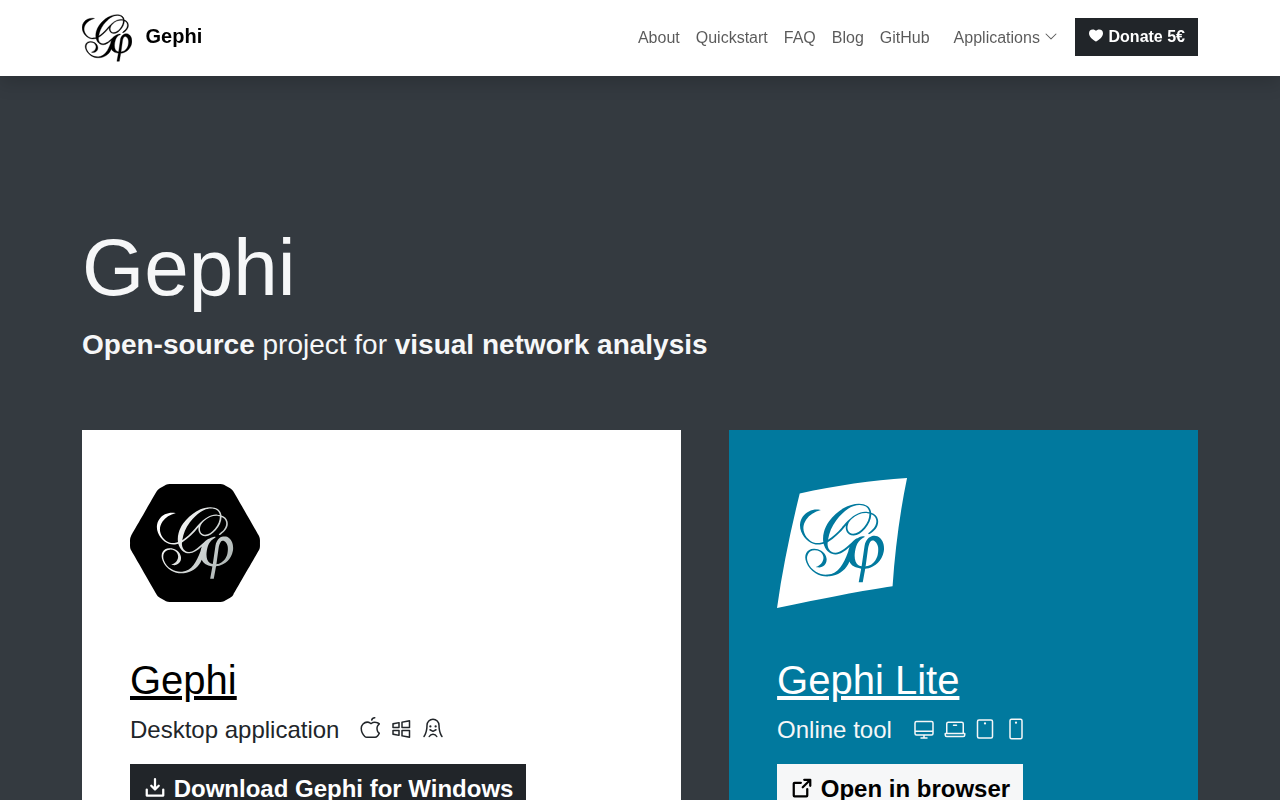
Gephi
Open-source platform for visualizing and manipulating large graphs
Databases & Data Tools
Integrative Genomics Viewer (IGV)
Visual exploration of genomic data
Window & Desktop Management
Memory-Map
GPS navigation software