
Grid Analysis and Display System
Access, manipulate, and visualise earth science data
The system provides a macOS‑based environment for working with earth‑science datasets. It enables users to load data from various sources, apply transformations, and explore the information through interactive visualisations. The interface supports common operations such as filtering, re‑projecting, and combining layers, allowing researchers and analysts to prepare data for further study.
Visualization tools include maps, charts, and three‑dimensional displays that can be customized to highlight specific variables or temporal ranges. Users can adjust rendering parameters, export images, or generate export for inclusion in reports and presentations. The software’s workflow is designed for iterative analysis, letting users quickly modify data and see the effects in real time.
Targeted at geoscientists, environmental engineers, and anyone needing to examine spatial datasets, the application offers a stable, production‑ready solution for routine data handling and visual exploration on macOS platforms.
Reviews
Loading reviews…
Similar apps
Databases & Data Tools
GeoMapApp
Browse, visualise and analyze geoscience data sets
Databases & Data Tools
Panoply netCDF, HDF and GRIB Data Viewer
Plot geo-referenced data from netCDF, HDF, and GRIB
Code Editors & IDEs
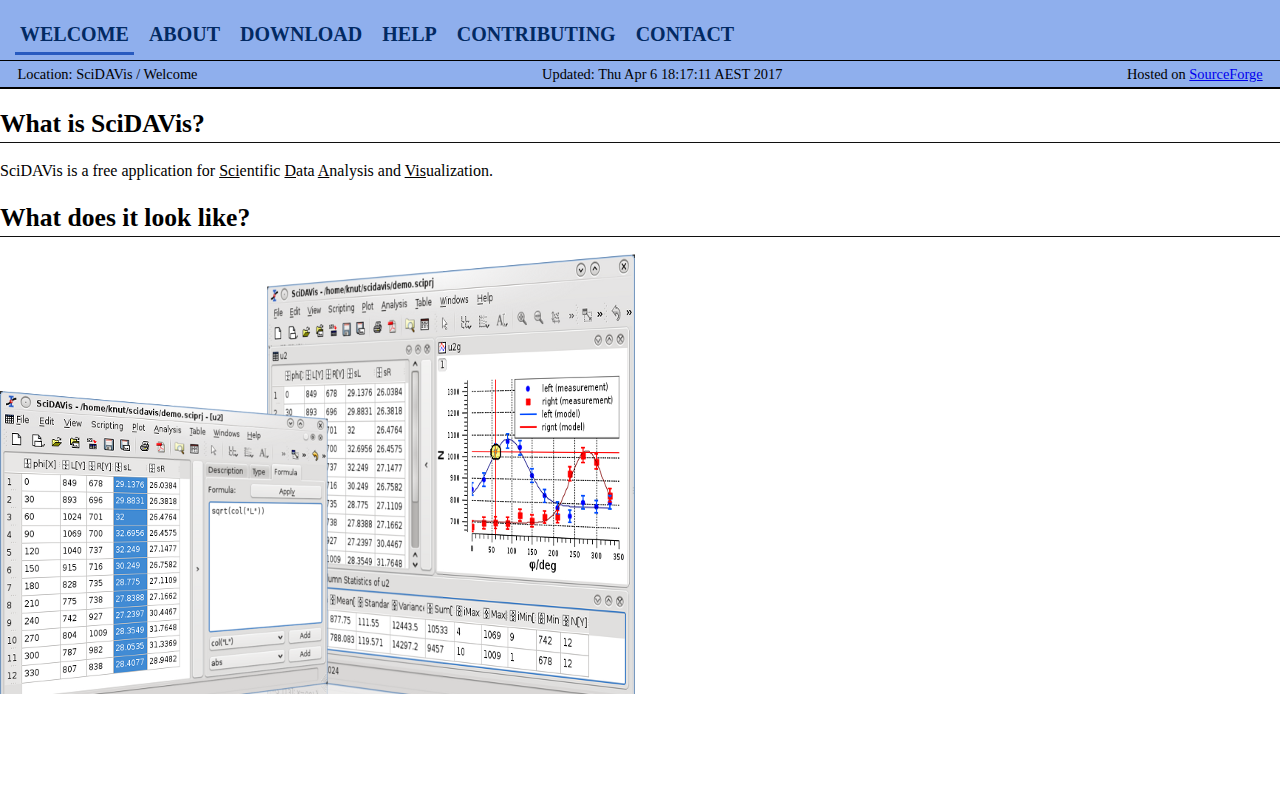
SciDAVis
Application for scientific data analysis and visualization
Databases & Data Tools
Couchbase Server
Distributed NoSQL cloud database
System Monitoring & Maintenance
Tableau Desktop
Data visualization software
Documents, Forms & Contracts
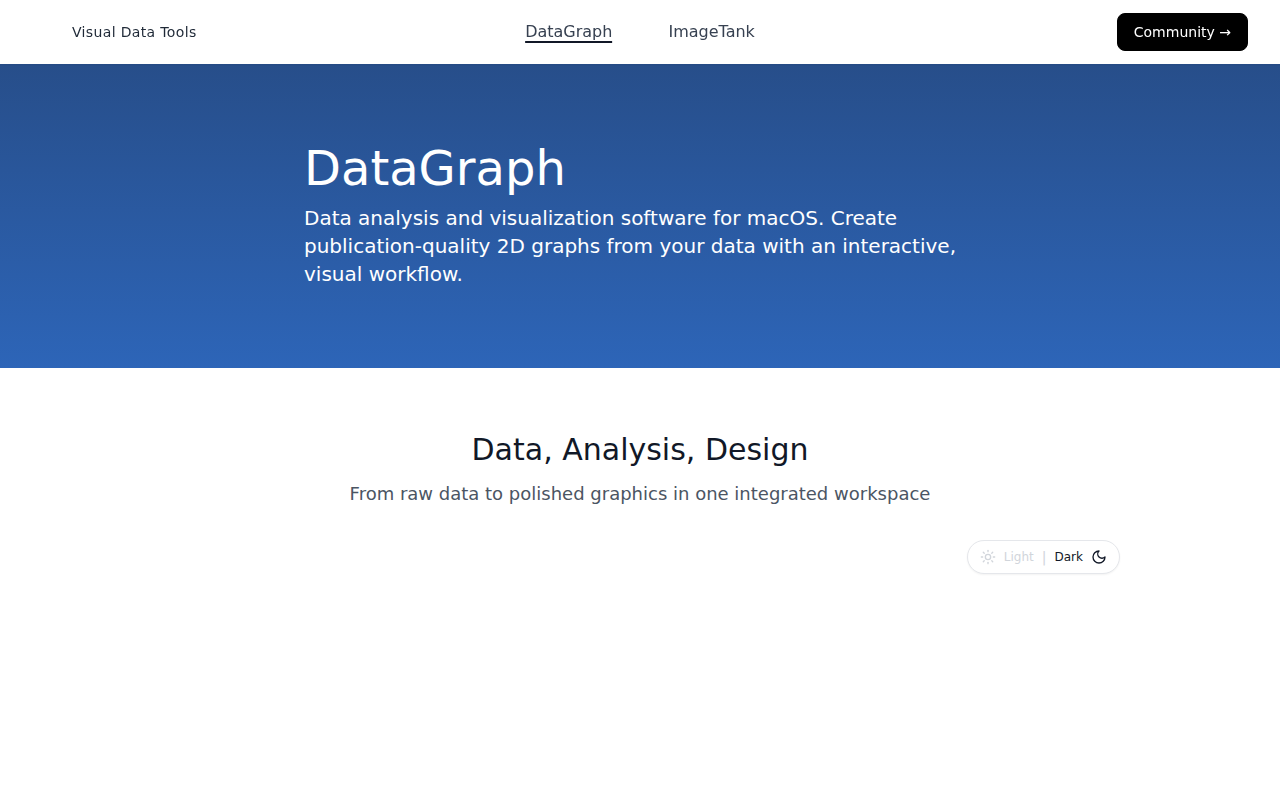
DataGraph
Scientific/statistical graphing software