Panoply netCDF, HDF and GRIB Data Viewer
Plot geo-referenced data from netCDF, HDF, and GRIB
Panoply reads netCDF, HDF, GRIB and similar scientific data files and generates visualizations of geo‑referenced and other multidimensional arrays. It can produce color contour plots for latitude‑longitude, latitude‑vertical, longitude‑vertical, time‑latitude or time‑vertical slices, as well as generic 2‑D arrays, and line plots for one‑dimensional data. Users may combine two geo‑referenced datasets by differencing, summing or averaging, and can map trajectory data following the CF convention.
The application offers over 200 map projections, optional continent outlines or masks, and a wide selection of built‑in color tables, with support for custom ACT, CPT or RGB tables. Plots can be saved as bitmap images (GIF, JPEG, PNG, TIFF) or vector graphics (PDF, PostScript, SVG), and map visual can be exported as KMZ. Animations are exportable as MP4 videos or sequences of frame images.
Panoply runs on macOS, Windows and Linux, requiring Java 11 or later. It can open remote datasets via HTTP/HTTPS, S3, THREDDS or OPeNDAP, and provides tools for exploring catalogs and downloading additional color tables or map overlays. The software is stable and maintained by NASA’s Goddard Institute for Space Studies.
Reviews
Loading reviews…
Similar apps

Databases & Data Tools
Grid Analysis and Display System
Access, manipulate, and visualise earth science data
Databases & Data Tools
GeoMapApp
Browse, visualise and analyze geoscience data sets
Databases & Data Tools
GPlates
Plate tectonics program
Databases & Data Tools
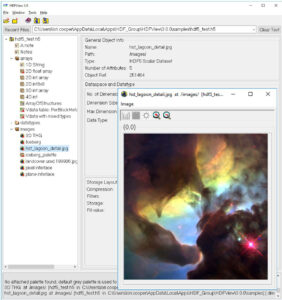
HDFView
Tool for browsing and editing HDF files
Databases & Data Tools
LabPlot
Data visualization and analysis software

Code Editors & IDEs
ParaView
Data analysis and visualization application